Monitoring is a crucial part of any production application, and it’s importance is increasing as we move towards cloud native. For all the benefits of distributed, microservice applications, there are challenges which come along as well. The complexity of the system has increased considerably. The number of pieces involved (applications, datastores, services, etc) has multiplied, and they are now distributed across various servers, data centers or even continents. On top of this, we should be treating all of these parts as dynamic and ephemeral. To get a grasp on these distributed applications and the infrastructure on which they run, a comprehensive monitoring solution is necessary. This is what we were looking for when we had the opportunity to contribute to the FashionTrade team as they moved towards their production launch.
Initial setup
As we are running our infrastructure on Google Container Engine (GKE) we initially had Stackdriver in place as both our logging and monitoring solution. Stackdriver is a company acquired by Google and is (at least superficially) integrated with the Google Cloud console. However, as we began looking at the metrics we were collecting, we quickly noticed the integration between the tools was lacking, and we were missing some key features. Without going into too many details, Stackdriver doesn’t have any real understanding of the Kubernetes landscape (pods, etc) at this point, and we were unable to get clear answers on Google’s roadmap for further integrating Stackdriver with GKE. Stackdriver is both a logging and monitoring solution, we also ran into some pain points on the logging side, so we decided to start looking for alternative options. In this post, I am solely looking at the monitoring solution (the logging side may come as a later post).
Buy vs. Build
As is often the case when looking to add functionality, the first question is “buy or build”. When it comes to application monitoring there are many products and services available. If you are looking for open source tooling, Prometheus stands out as the leading solution. With its adoption into the Cloud Native Computing Foundation (CNCF) last year, it is an obvious candidate. For hosted SaaS solutions there are plenty to look at: NewRelic, DataDog, AppDynamics, CoScale, etc. We evaluated either building, configuring, and hosting our own in-house setup vs. paying for one of the existing hosted solutions. While the former option appealed to me more as an interesting technical challenge, we opted for a SaaS product based on our short term needs of getting a monitoring solution in place quickly. Our focus in the near term is on product development and feature implementation as we head towards product launch. We made this decision with the reassurance that we would revisit our choice six months down the line to see if our monitoring needs were being met.
Once we decided on going with a hosted solution, we came up with a list of basic criteria including cost structure and built-in integrations for Kubernetes, Kafka, and Elasticsearch. Based on those criteria and some recommendations we opted to try out DataDog as an initial solution.
Infrastructure
The basic infrastructure setup for DataDog offers two ways of providing data. We can either push data directly to the SaaS platform via their API, or run agents on our hosts. The agents collect data and forward it to the DataDog SaaS platform for us. We want to run an agent on each of our hosts, since we are monitoring our infrastructure as well as our applications (as any self-respecting monitoring solution should). Kubernetes solves this by means of a DaemonSet. A DaemonSet in Kubernetes allows us to ensure there is one DataDog agent running (in a pod) on each cluster node. Even as we scale up (or down). Additionally, we run agents on our non Kubernetes nodes (e.g. Kafka and Elasticsearch). The basic infrastructure looks like this:
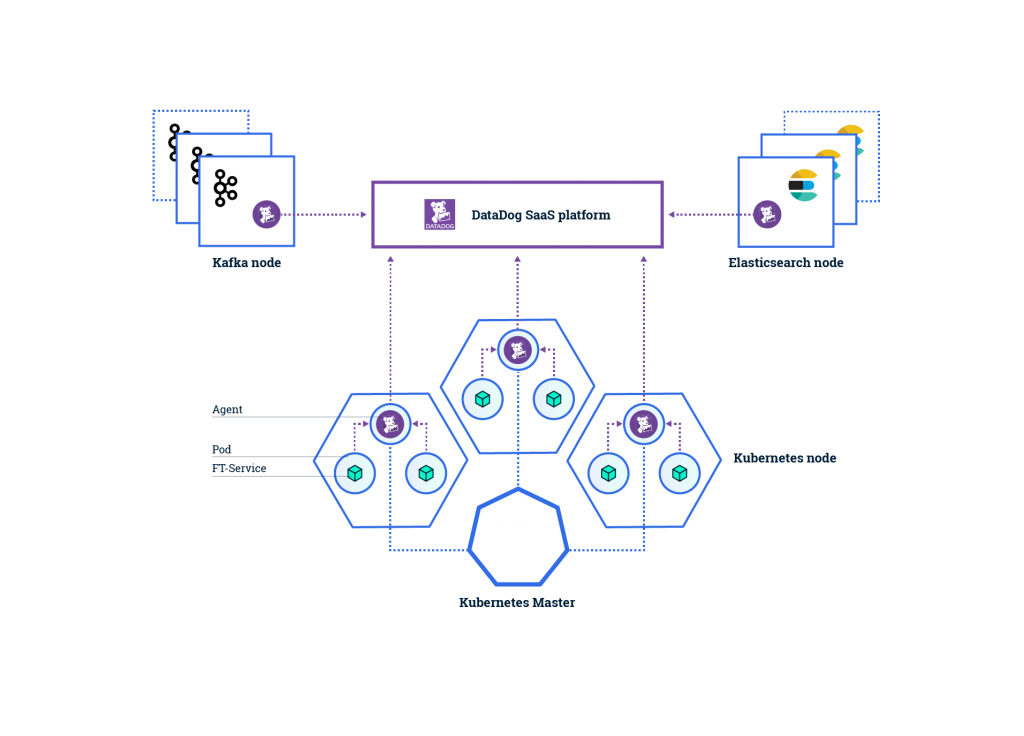
Another alternative I have seen for running DataDog on Kubernetes is to deploy the agents as sidecars in every pod. The advantages here are that both the agent and your service share an IP so can find each other on localhost. However, the extra resources required in running the superfluous agents outweigh the convenience in my view. Also, we can easily expose the agents by defining a Kubernetes service on top of the DaemonSet.
kind: Service
apiVersion: v1
metadata:
  name: dd-agent
spec:
  ports:
  - port: 8125
    name: dd-agent-port
    targetPort: 8125
    protocol: UDP
  selector:
    app: dd-agent
Push or Pull?
There is an ongoing debate on whether metrics should be push or pull based. Some notable arguments regarding pull based metrics come from the likes of Google, and Prometheus. However, having looked at both sides, it seems that depends on your setup. For the most part, the ‘pull’ advocates are defending against the arguments that pull-based systems do not scale. While this argument was valid for certain monitoring tools (e.g. Nagios), it is possible with a proper monitoring setup, using a tool such as Prometheus, to scale out as necessary. That being said, we chose a strictly push-based metrics setup. The main reason is the upfront development costs. Since the majority of our backend services are written on top of Dropwizard, with just a minimal amount of configuration we get a large amount of JVM and application metrics.
All of the concerns around push based systems I have seen, such as target discovery, knowledge of service health, are a moot point when using an orchestration layer (Kubernetes) which is integrated with our monitoring system. For example, if a service goes down, in traditional monitoring systems this may not be evident because the only thing the monitoring system sees is that data is not being reported, which could be for a variety of reasons. However within our Kubernetes setup, a service which goes down will (a) immediately get restarted and (b) trigger an event which is recorded in our monitoring solution, thanks to the DataDog - Kubernetes integration.
Conclusion
The technology stack at FashionTrade is leading edge: microservices, containers, orchestration platform. Thanks to this setup, we have been able to automate many of the traditionally manual system administrator type tasks (deployment, scaling, network configuration). This allows developers to focus on solving the relevant, domain problems… until something goes wrong. This is where having a proper monitoring solution becomes critical. When an incident occurs, we want to a) be aware of it before our end customers and b) have the necessary data at hand to understand where the problem is. However important, it is not part of our core business and we do not want to divert significant engineering resources away from our product. Finding a pre-built “plug and play” solution which solved our short term needs was a great win, as mentioned above we will revisit this in the near future to validate that the solution still fits.
Want to know more about monitoring in the cloud native era? Download our whitepaper below.